Fancy Memory for ETL pt. 2
Pinned memory changes both the cost of each transfer and the behavior of the pipeline. It pays an upfront allocation cost, but can reduce spill overhead, lower memory pressure, and improve end-to-end runtime
In the previous post, I explored how spilling can enable larger-than-VRAM workloads to run on a GPU. Spilling comes with a cost, but pinned memory can reduce memory transfer bottlenecks. In this post, I want to dive a little deeper into what's happening with pinned and pageable memory. To do that exploration, we'll use Nsight Systems (nsys) which can give us detailed profiling information on the workflow I developed in pt 1.
nsys profile -o pageable-spill -f true -t cuda,nvtx --stats=false python script.py
Full Timeline View
As a reminder, I measured the same join workflow which requires more VRAM than an L40 has (48GB) using two different memory types: regular/pageable host memory: 27s and pinned host memory: 23s. Those numbers are the query execution times after engine initialization. The pinned-memory Nsight trace below also includes the one-time pinned-memory pool initialization and explains why we see more than 23s of time in the trace.
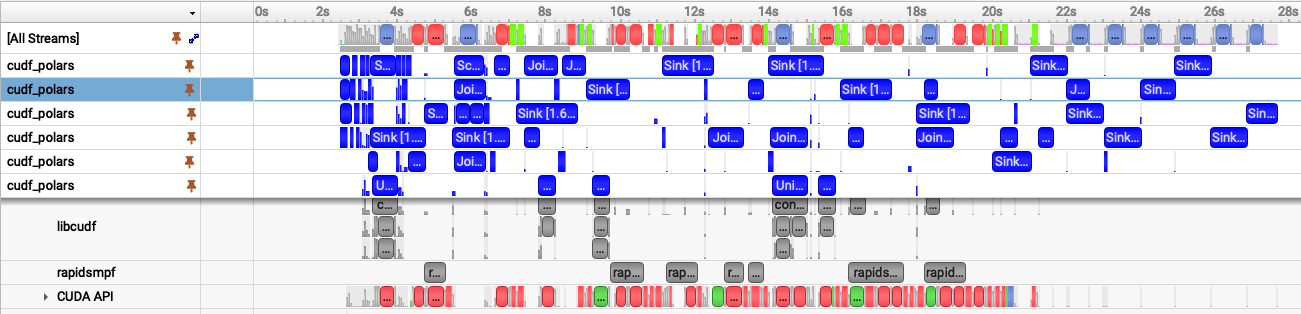 Fig 1. Nsight Systems timeline showing the pageable-memory cudf-polars join workflow.
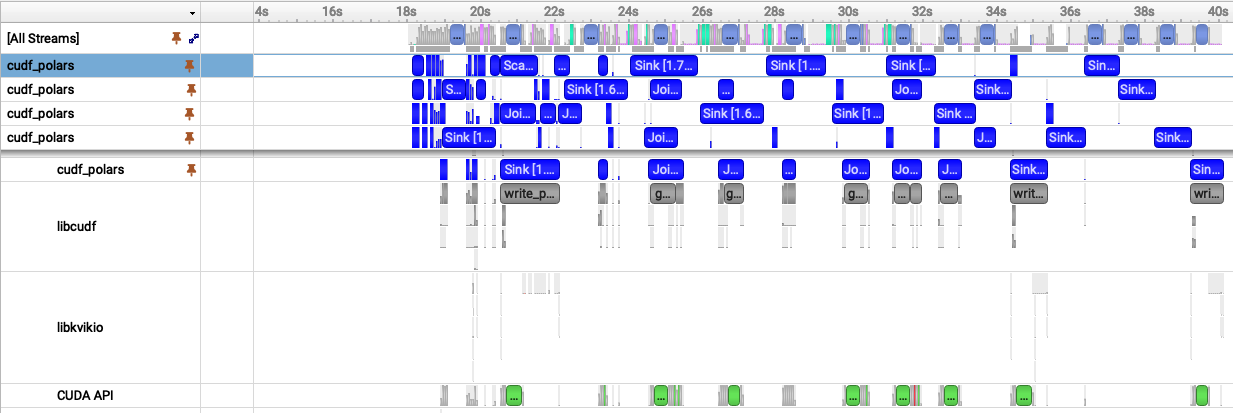 Fig 2. Nsight Systems timeline showing the pinned-memory cudf-polars join workflow.
With these two images laid out together, we can visually see similarities and differences:
- Both have multiple cudf_polars streams (blue bars) though Fig 1. has 6 and Fig 2. has 5 -- let's come back to that
- With pageable memory (fig 1) we see a load of red and green transfer bars and they start near the 2s mark
- With pinned memory (Fig. 2), the transfer bars are narrower than the pageable transfer bars in Fig. 1, meaning each transfer takes less time. The query work also starts near the 18s mark because the first ~18s are spent allocating the pinned memory pool.
As a reminder, here's the aggregate time spent spilling (device-to-host) and unspilling (host-to-device) for both memory types:
| Mode | Direction | Time |
|---|---|---|
| Pageable host spilling | Device -> host | 8.06 s |
| Pageable host spilling | Host -> device | 4.06 s |
| Pinned host spilling | Device -> pinned host | 2.64 s |
| Pinned host spilling | Pinned host -> device | 3.15 s |
It's interesting: pageable host spilling is slower when moving data Device->Host compared with Host->Device. However, when using pinned memory, the throughput in both directions is nearly the same. Why? Zooming into a region where the workflow is spilling can help us see why.
Zooming In: Pageable Memory
| Pageable device -> host | Pageable host -> device |
|---|---|
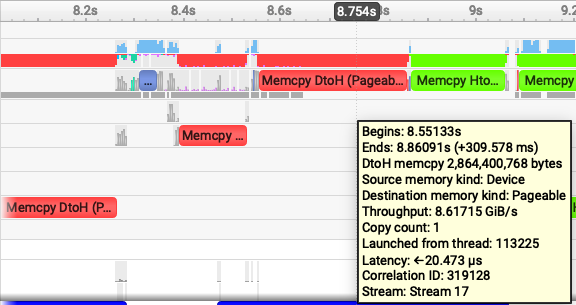 |
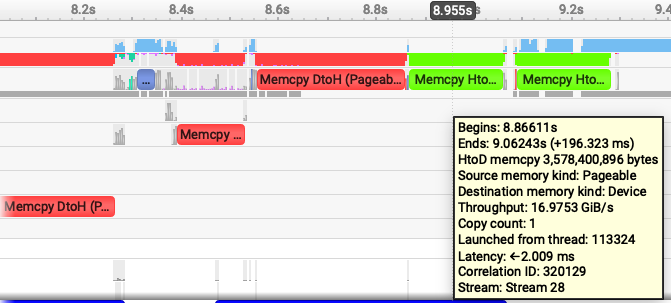 |
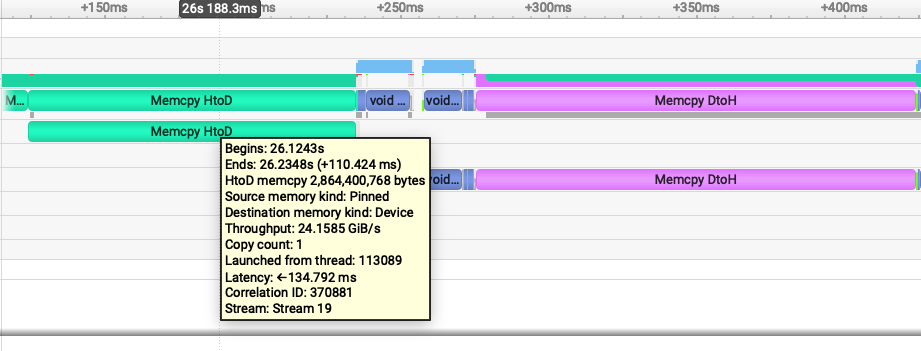
nsys lets us easily see not just how much time was spent spilling, but also how much data was transferred, and data/time gives us a throughput measurement. The following images are samples, each transfer will have some noise (a few may have spikes), but these are representative. In the zoomed-in images, Device->Host is 8.6GiB/s and Host->Device is ~17 GiB/s. When transferring data using regular pageable memory, the host has to first allocate memory before the device can spill and it's apparently quite costly to do this. When moving data back to the device, there is no allocation cost so it's significantly faster.
Quick aside: cuDF-Polars and RapidsMPF use CUDA’s stream-ordered allocator, cudaMallocAsync, by default. It’s fairly technical, but the short version is that
cudaMallocAsyncavoids many costly device-wide synchronization points by making allocation and free operations stream-ordered.
Zooming In: Pinned Memory
Let's do the same kind of inspection of the pinned memory nsys plot:
| Pinned host -> device | Pinned device -> host |
|---|---|
 |
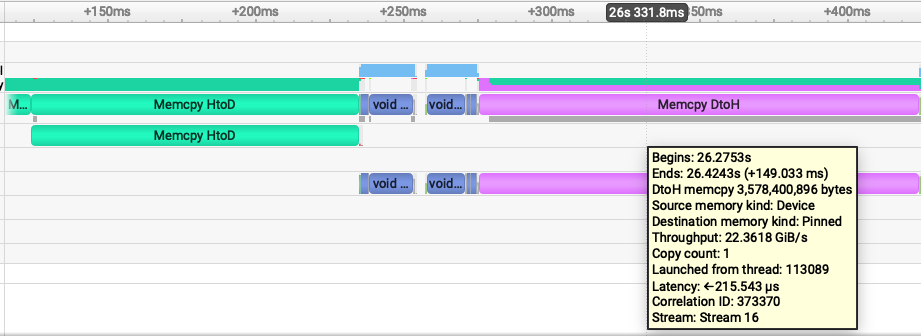 |
Device->Host data movement is a lot faster: 24 GiB/s and Host->Device is 22GiB/s. Pinned memory throughput is so much faster because we paid all the host memory allocation fees during initialization. The host doesn't have to allocate any memory -- it's already there for the device to use!
Why though is Host->Device faster for pinned memory compared with pageable memory? It's great fun getting an excuse to learn about how machines actually work. We aren't going to dive very deep, but just peer into the depths without falling too far in.
When the host allocates pageable memory, the operating system is still largely in control of that memory and still responsible for running the entire machine! The OS can move the memory to another physical location or even swap it to disk. This means the host, the OS, is responsible for moving the data and safeguarding the memory from corruption during the process. It’s safe but slow, and one of the primary reasons why Direct Memory Access (DMA) was created to let devices transfer data directly to and from memory, reducing CPU involvement in the copy path. In a way, it’s one of the freedoms, or footguns, the OS gives back to the application developer.
Interestingly, DMA dates back to computing in the 50s, when many of these ideas around pipelining and overlapping execution were already taking shape.
So, Host->Device is faster with pinned memory because the host memory is pagelocked. Since those pages cannot be moved or swapped out by the OS during the transfer, the GPU can use DMA to copy directly from host memory to device memory, avoiding the extra staging and CPU/OS overhead required for pageable memory.
With nsys we can start to see why pinned memory and DMA can be so impactful. (We may explore RDMA/GPUDirect RDMA in a later post.)
Why Copy Time Is Not Wall-Clock Time
So far we have looked at individual transfer costs; now let's connect that back to the full query timeline. Why, if we spend 12 seconds spilling with pageable memory and only 5 seconds spilling with pinned memory, do we not see wall-clock time reduced by 7 seconds?
It's understandably confusing because cuDF-Polars and RapidsMPF are doing work concurrently and, when the hardware allows it, in parallel. Spilling is not a single serial phase that blocks the whole query. This is pipelining; different chunks of the query can be in different stages at the same time. One chunk may be spilling to host, another may be unspilling back to the device, and another may be running libcudf kernels.
CUDA work in a single stream is ordered, Kernel A -> allocate memory -> Kernel B -> free memory happens sequentially. But work submitted to different streams can overlap. RapidsMPF manages the pipeline for us, which is why the spill times do not translate directly into overall execution time.
This is also a good time to return to the stream-count puzzle from the nsys profiles at the beginning.
Both have multiple cudf_polars streams (blue bars) though Fig 1. has 6 and Fig 2. has 5 -- let's come back to that
The pageable run shows six active cudf_polars streams, while the pinned run shows five. That does not mean pageable memory has better parallelism. We want higher perf and higher throughput, not necessarily more parallelism or more concurrency, though those traits often correspond to overall lower execution time. The pageable transfers are slower, so more chunks pile up in flight and nsys shows more active streams. Pinned memory moves data faster, reduces memory pressure faster, and lets the pipeline drain sooner.
With num_py_executors, cuDF-Polars sets the maximum number of Python worker threads available to drive RapidsMPF work. The number of active CUDA streams RapidsMPF uses depends on how much work the query exposes at runtime, plus memory pressure, dependencies, hardware availability, and backpressure building up in the pipeline.
Summary
Pageable spilling spends more time moving data and can make the trace look busier because work backs up. Pinned spilling pays an upfront allocation cost, but spends less time spilling during the query. For larger out-of-core workflows, that can mean better throughput, less memory pressure, and fewer OOM surprises.